使用Prometheus-client模块来监控服务器端口,ssl证书到期时间
实现过程
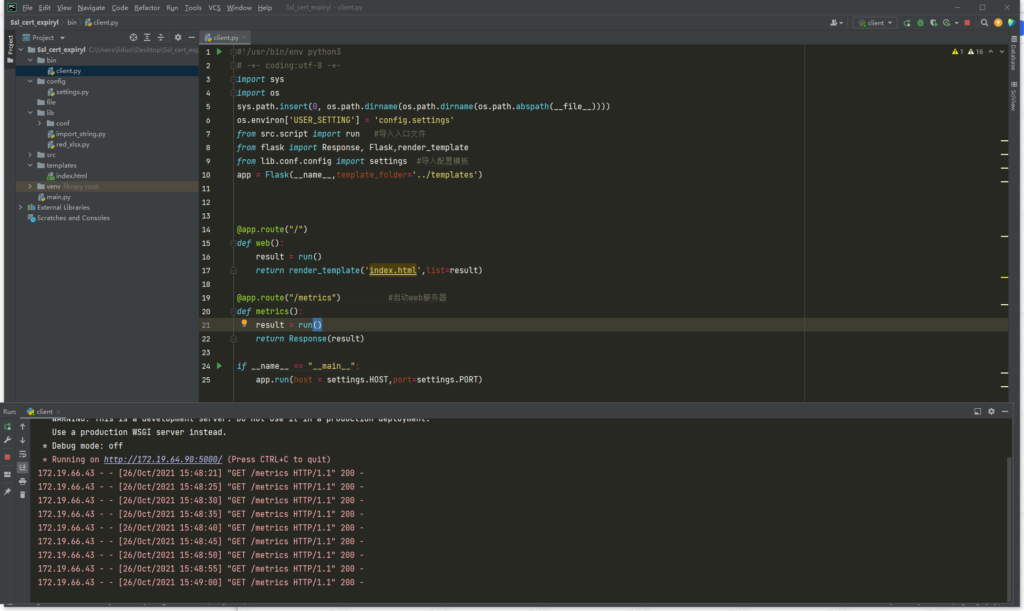
1 2 3 4 5 6 7 8 9 10 11 12 13 14 15 16 17 18 19 20 21 22 23 24 25 26 import sysimport ossys.path.insert(0 , os.path.dirname(os.path.dirname(os.path.abspath(__file__)))) os.environ['USER_SETTING' ] = 'config.settings' from src.script import run from flask import Response, Flask,render_templatefrom lib.conf.config import settings app = Flask(__name__,template_folder='../templates' ) @app.route("/" def web (): result = run() return render_template('index.html' ,list =result) @app.route("/metrics" def metrics (): result = run() return Response(result) if __name__ == "__main__" : app.run(host = settings.HOST,port=settings.PORT)
定义配置文件,不定义会采用默认文件 settins.py
1 2 3 4 5 6 7 8 9 10 11 12 13 14 15 16 17 18 19 20 21 22 23 24 25 26 27 28 29 30 31 32 33 34 35 36 37 38 39 40 PORT = '5000' HOST = '172.19.64.90' PLUGINS_DICT = { 'port' : 'src.plugins.port.Port' , 'ssl' : 'src.plugins.ssl.Ssl' , } PORT_FILE = '' SSL_FILE = '' PORT_GAUGE = { 'name' : "port_status" , 'documentation' :"IP PORT SOCKET CONNECT STATUS" , 'labelnames' :{ 'ip' :'127.0.0.1' , 'port' :'22' , } } SSL_GAUGE = { 'name' : "ssl_check" , 'documentation' :" SSL_CERT_EXPIRYL " , 'labelnames' :{ 'url' :'pook.com' , } }
定义采集指标类型 plugins 父类文件
1 2 3 4 5 6 7 8 9 10 11 12 13 14 15 16 17 18 19 20 21 22 23 24 25 26 from prometheus_client import generate_latest, Gauge, Infofrom prometheus_client.core import CollectorRegistryfrom lib.conf.config import settingsclass PortHandler (): def __init__ (self ): self.REGISTRY = CollectorRegistry(auto_describe=False ) self.portcheck = Gauge(name=settings.PORT_GAUGE['name' ], documentation=settings.PORT_GAUGE['documentation' ], labelnames=settings.PORT_GAUGE['labelnames' ], registry=self.REGISTRY) def handler (self ): raise NotImplementedError('handler() must be Implemented' ) class SslHandler (): def __init__ (self ): self.REGISTRY = CollectorRegistry(auto_describe=False ) self.sslcheck = Gauge(name=settings.SSL_GAUGE['name' ], documentation=settings.SSL_GAUGE['documentation' ], labelnames=settings.SSL_GAUGE['labelnames' ], registry=self.REGISTRY) def handler (self ): raise NotImplementedError('handler() must be Implemented' )
端口检测插件
1 2 3 4 5 6 7 8 9 10 11 12 13 14 15 16 17 18 19 20 21 22 23 24 25 26 27 28 29 30 31 32 33 34 import socketfrom prometheus_client import generate_latest, Gauge,Infofrom prometheus_client.core import CollectorRegistryfrom src.plugins.base import PortHandlerfrom concurrent.futures import ThreadPoolExecutorhost_list = [{'ip' :'lixiansen.xyz' ,'port' :123 },{'ip' :'172.19.66.45' ,'port' :8080 },{'ip' :'172.19.66.45' ,'port' :8999 }] class Port (PortHandler ): def run (self,ip,port ): """ socket检测端口连通性 端口存活返回true否则返回false """ s = socket.socket(socket.AF_INET, socket.SOCK_STREAM) s.settimeout(1 ) try : s.connect((ip, int (port))) s.shutdown(1 ) return True except : return False def handler (self ): for i in host_list : status = self.run(i['ip' ],i['port' ]) self.portcheck.labels(i['ip' ], i['port' ]).inc(status) result = generate_latest(self.REGISTRY).decode() return result
ssl证书检测插件
1 2 3 4 5 6 7 8 9 10 11 12 13 14 15 16 17 18 19 20 21 22 23 24 25 26 27 28 29 30 31 32 import socketfrom prometheus_client import generate_latest, Gauge,Infofrom prometheus_client.core import CollectorRegistryfrom src.plugins.base import SslHandlerfrom urllib3.contrib import pyopensslfrom datetime import datetimeclass Ssl (SslHandler ): """ openssl检测证书到期时间 返回剩余时间 """ def run (self,url ): try : x509 = pyopenssl.OpenSSL.crypto.load_certificate(pyopenssl.OpenSSL.crypto.FILETYPE_PEM,pyopenssl.ssl.get_server_certificate((url, 443 ))) start_time = datetime.strptime(x509.get_notAfter().decode()[0 :-1 ], '%Y%m%d%H%M%S' ) return (start_time - datetime.now()).days except Exception as e: return False def handler (self ): url_list = ["pook.com" ,"lixiansen.xyz" ,"qq.com" ] for url in url_list: value = self.run(url) self.sslcheck.labels(url).inc(value) result = generate_latest(self.REGISTRY).decode() return result
入口文件
1 2 3 4 5 6 7 8 9 10 11 12 13 14 15 16 17 from src.plugins.port import Portfrom flask import Response, Flaskfrom lib.conf.config import settingsfrom lib.import_string import get_classdef run (): a = [] for val,path in settings.PLUGINS_DICT.items(): cls = get_class(path) obj = cls() gauge = obj.handler() a.append(gauge) return a
配置类
1 2 3 4 5 6 7 8 9 10 11 12 13 14 15 16 17 18 19 20 21 22 23 24 25 26 27 28 29 30 31 32 33 34 import osfrom . import defaultimport importlibclass Settings (): """ 创建配置文件对象 settings """ def __init__ (self ): conf_str = os.environ.get('USER_SETTING' ) for name in dir (default): if name.isupper(): val = getattr (default, name) setattr (self, name, val) module = importlib.import_module(conf_str) for name in dir (module): if name.isupper(): val = getattr (module, name) setattr (self, name, val) settings = Settings()
动态导入库
1 2 3 4 5 6 7 8 9 10 11 12 13 14 15 16 import importlibdef get_class (path ): """ 动态提取模块 :param path: :return: """ module_str, cls_str = path.rsplit('.' , maxsplit=1 ) module = importlib.import_module(module_str) return getattr (module, cls_str)
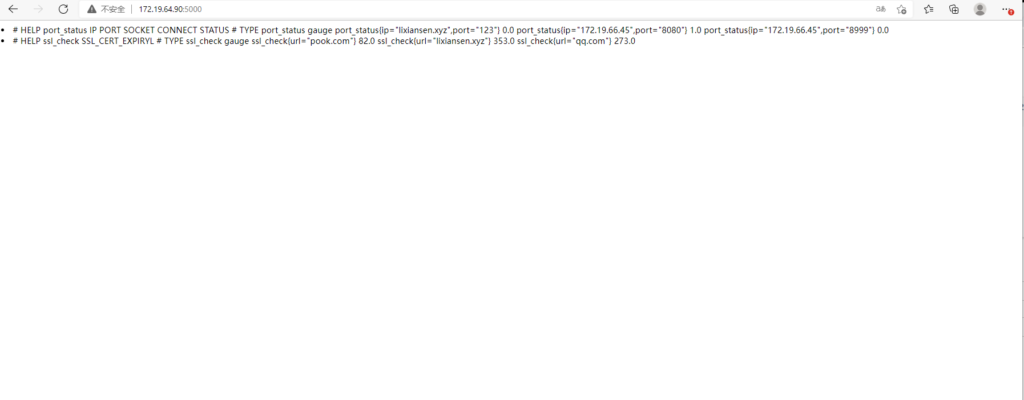
运行程序,检查web界面
整合prometheus监控
修改prometheus配置文件,重启prometheus
1
2
3
4
- job_name: "demo" scrape_interval: 5 s static_configs: - targets: ["172.19.64.90:5000" ]
1 2 [root@node -1 prometheus] [root@node -1 prometheus]
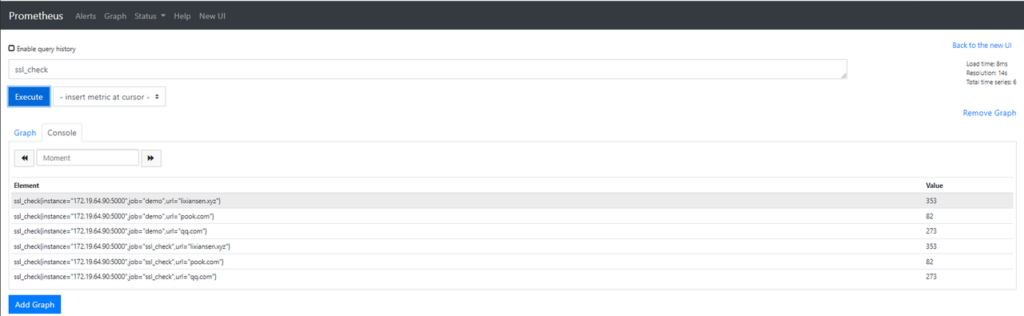
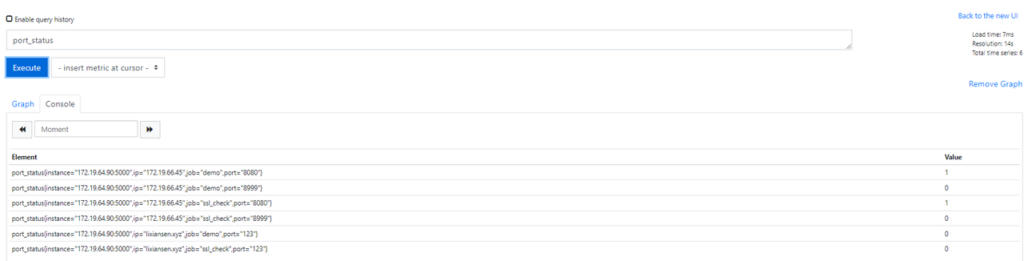
打开Prometheus,发现已经采集到数据,我们自定义的指标已经可以监控,可以结合alertmanager,grafana,做到警报,展示
实现了基本的需求,功能不是很强大,很多地方并不完善,数据导入,监控项,需要后期新增修改,持续完善。